Our Experts will contact you providing a quote,
information and estimated timeframe to
your project needs.

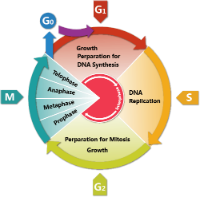
● G1 Phase (Gap 1): The gap between the completion of mitosis and the beginning of DNA duplication.
● S Phase (Synthesis Phase): DNA replication occurs during this phase.
● G2 Phase (Gap 2): A growth period after the completion of DNA duplication, wherein the cell prepares for mitosis.
● M Phase, also D Phase (mitosis or division): Cell growth stops at this stage, and cell division is completed.
The propidium iodide (PI) method is a more common method of cell cycle period detection. PI is an intercalating nucleic acid fluorescent dye, which can bind to the nucleic acids of DNA by intercalating between base pairs. The amount of binding is proportional to the content of DNA. Using flow cytometry analysis, the status of DNA distribution for each phase of the cell cycle can be obtained, and the proportion of cells at each phase can be calculated. After PI staining, assuming that the fluorescence intensity of cells in G0/G1 phase is 1, then the theoretical value of fluorescence intensity of cells in G2/M phase - containing double genomic DNA - is 2 and the fluorescence intensity of cells in S phase that undergoing DNA replication is between 1-2. From this, we can get the distribution status of cells at various stages with exact percentages (G0/G1%, S%, G2/M%), and understand the proliferation ability. In tumor pathology research, the ratio of cells in S phase is usually used as an indicator to access tumor proliferation status.
The length of cell cycle is related to the particular cell type of the species. For example, the cell cycle of mouse duodenal epithelial cell is 10 hours, 24 hours for human gastric epithelial cells, 18 hours for bone marrow cells, 18 hours for cultured human fibroblasts, 14 hours for Chinese hamster ovary (CHO) cells, and 21 hours for HeLa cells. Different types of cells have different lengths of the G1 phase, which is the main reason for cell cycle differences.
